Graphs and Combinatorial Algorithms
Getting Started
Exercise 1
Each of the following can be modelled using some kind of graph. For each, describe what might be the most appropriate kind of graph to use using the above terminology. What do nodes and edges represent? What does a path represent? Is it directed? Connected? Does it contain any significant components?
- A graph of possible derivations in a formal system Each node represents a state in the formal system. Each directed edge represents a transition between states. Each directed path represents a derivation. If it is a graph of derivations from a single initial state, then it will be connected. If it is all possible derivations from multiple initial states, then it may not be connected. It may or may not contain multiple strongly connected components depending on the formal system.
- The road network in the UK Nodes might represent junctions and edges represent roads between these junctions. As some roads are one way, it would be natural for the edges to be directed nodes. A multigraph could be used to have each lane of a multi-lane road represented by parallel directed edges. The mainland UK road network would form one component (I assume), with islands being other components. There might be multiple strongly connected components in a single component if we consider e.g. off-ramps at ports.
- A social network Nodes might represent individuals. Edges represent relationships between individuals. These might be directed if the relationship is one-way (e.g. following a person on Twitter), or undirected if the relationship is two-way (e.g. friending someone on Facebook). The graph is not connected if there are people who have no friends. While you might expect groups of friends to be part of the same strongly connected component, such would likely include many more, if not almost all individuals.
- The Internet Nodes might represent computers, routers, switches and other network infrastructure. Edges might represent wired or wireless connections between these. These connections are probably mostly undirected, but there may be some directed edges. Some computers are not connected to the internet all the time, so we might take this to mean the graph is not connected.
Exercise 2
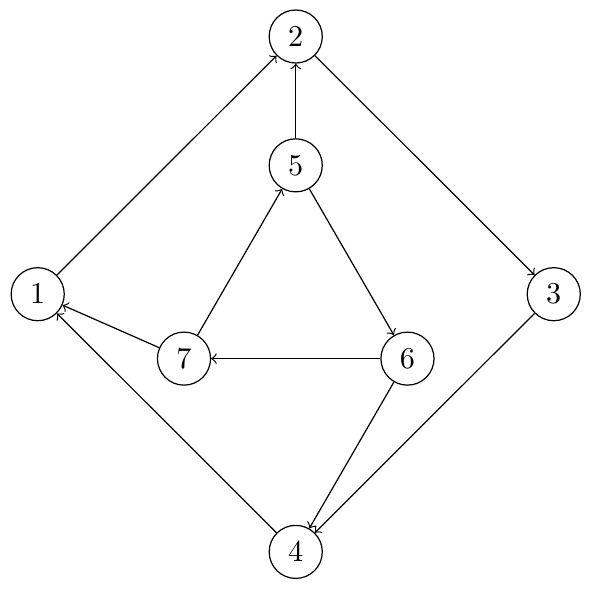
Describe the graph below using the above terminology as completely as you can. Then describe each node. What is the in-degree, out-degree, and degree of the nodes? Is the node a sources, sink, or transfer node?

- Is it possible to connect every node with one simple directed path?
- List all the directed simple cycles in this graph
- Identify the strongly connected components
- Draw the condensation graph for this graph
This is a directed connected cyclic graph with 8 nodes and 10 edges. It is not strongly connected. It has a two strongly connected components. Its maximum degree is 3. Its minimum degree is 3. All nodes are transfer nodes, there are no sources or sinks.
- Yes, e.g. \( \{5,6,7,1,2,3,4\} \)
- \( \{1, 2, 3, 4\} \), \( \{2, 3, 4, 1\} \), \( \{3, 4, 1, 2\} \),\( \{4, 1, 2, 3\} \), \( \{5, 6, 7\} \), \( \{6, 7, 5\} \), \( \{7, 5, 6\} \),
- \( \{1, 2, 3, 4\} \) and \( \{5, 6, 7\} \) form strongly connected components.
Exercise 3
Draw the undirected graph \( G = ( V, E ) \) where
What changes needs to be made (both to your diagram and to the set-theoretic representation) to make this a directed graph?
Exercise 4
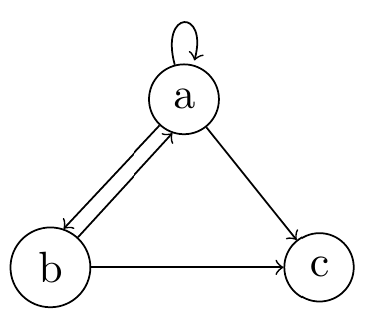
Complete the extensional definition of the graph shown below.

Bluetooth Case Study
Bluetooth is a short-range wireless technology that can transfer data up to around 2Mbps. However, the data transfer rate varies widely depending on the device and the environment. Bluetooth 5 offers different data rates to support different ranges (2Mbps, 1Mbps, 500kbps, 125kbps), with lower data rates to support low-energy and long-range applications. Bluetooth connections rely on devices being relatively close to each other.
A research team want to test whether they can reliably and efficiently transfer data over long distances by exploiting a dynamic, ad-hoc network of bluetooth-enabled smartphones. The experiment would be performed on a University campus with a large number of student participants. Each participant would install an app on their smartphone. When the app is running, the device would be able to connect to any other device in Bluetooth range and transfer data up to the limit possible by the Bluetooth connection achieved (which would depend on various factors including the devices involved and the environment). The app would also report some information about the devices it is connected to back to the researchers (details not yet specified). Ultimately the researchers want to be able to efficiently transmit a large quantity of data from one device on the network to another, even if those devices cannot directly see each other.
Data Transfer Rates
As part of this project, one problem the researchers want to be able to solve is to identify the theoretical maximum data transfer rate that can be achieved between an arbitrary pair of devices that are running the app. Assume that the researchers are able to use the data reported to them to construct a complete graph of all devices in the network. They also know the data transfer rate possible between each pair of devices (each device reports the rate at which it can transfer data to all other devices it is within range of). However, many devices are not directly connected to one another.
A user turns on their smartphone, connecting their device to the network. Assuming you have a copy of the graph of the complete network, what algorithm could be used to determine whether this device is connected to an arbitrary other device running the app? How does this algorithm work?
The researchers run a small pilot study to gather data about Bluetooth data transfer rates. In the first version of the app data transfer is only possible in a single direction for a given pair of devices. The following graph represents devices running the app (nodes), and the data transfer rates theoretically possible between directly connected pairs of devices (edges) at an instant in time when the data was collected. Each edge in the network is a directed edge.
Smartphone icon CC-BY-SA 3.0 G.Hagedorn / Wikimedia Commons
What is the maximum data transfer rate between the nodes $a$ and $c$? What property of these nodes means that this must be the case?
Describe an algorithm the researchers can use to identify the maximum data transfer rate possible between an arbitrary pair of nodes in the graph above.
Use the algorithm you identified above to find the maximum data transfer rate between the nodes $a$ and $b$ in the graph as shown above.
There are some assumptions that are being made here. In practice, while a single Bluetooth connection might achieve up to around 2Mb/s, when a single device is connected simultaneously to multiple other devices, it may not be able to support 2Mb/s connections with each of them simultaneously, due to the bandwidth of the Bluetooth chip and the interference that transferring data on one connection will mean for the other connections.
Researchers investigate this and find that each of the devices used in the pilot study has a capacity of 1024Kb/s.
Redraw the graph in such a way that the same algorithm can be used to find the MaxFlow with the additional constraint that each node has a capacity of 1024Kb/s.
Start by redrawing each node so that it becomes two nodes connected by a single directed edge.
Message distribution
Sometimes a message needs to be delivered to every device on the network. One initial proposal is that when a device receives a message is has not seen before, it passes it on to all connected devices. However, this will lead to devices receiving the same message multiple times. When distributing messages across this network, the researchers want to ensure that a device receives a message only once. In other words, if representing the message paths between devices, there should be no unnecessary connections (and thus no cycles).
The graph above represents the connectedness of devices in a pilot experiment. We are assuming messages can be passed in either direction if necessary.
There is a term to describe a graph (a tree) that connects each node in a cyclic graph without including cycles. What is it?
Spanning Tree
Describe an algorithm that can be used to construct a graph (a tree) that contains a single unique path from the source to each device, to ensure each device will receive the message only once.
Apply this algorithm step by step to the graph. Draw a graph that can be obtained using this algorithm.